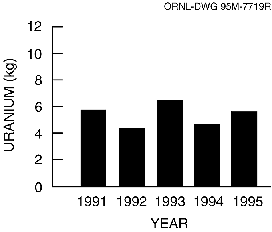
Fig. 4.13. Five-year trend of total uranium discharges from the Y-12 Plant Sanitary Sewer.
Printable Version of this Graph
 Printable Version of this Graph