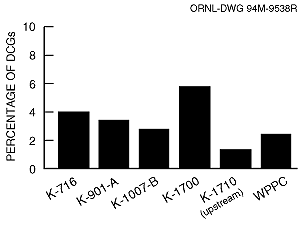
Fig. 5.16. Percentage of DCGs for K-25 Site surface water monitoring locations.
Printable Version of this Graph
 Printable Version of this Graph